
The Best — and Worst — States for Child Care, Ranked in Order

This week, Care.com introduced the Care Index, the first comprehensive data report on the current state of child care in the U.S., which ranks states based on quality, affordability and availability.
The big question is: where does your state rank?
With the average cost of child care coming in at about $18,000 per year ̵2; equivalent to the national average housing cost ̵2; new parents are in for a rude awakening when they look into child care centers and nannies.
[RELATED: ̶0;Want to Raise a Child? That̵7;ll Cost You $233,610̶0;]
And when it comes to quality and availability, they are often faced with an even more difficult reality.
Map of the Top Ten States for Child Care
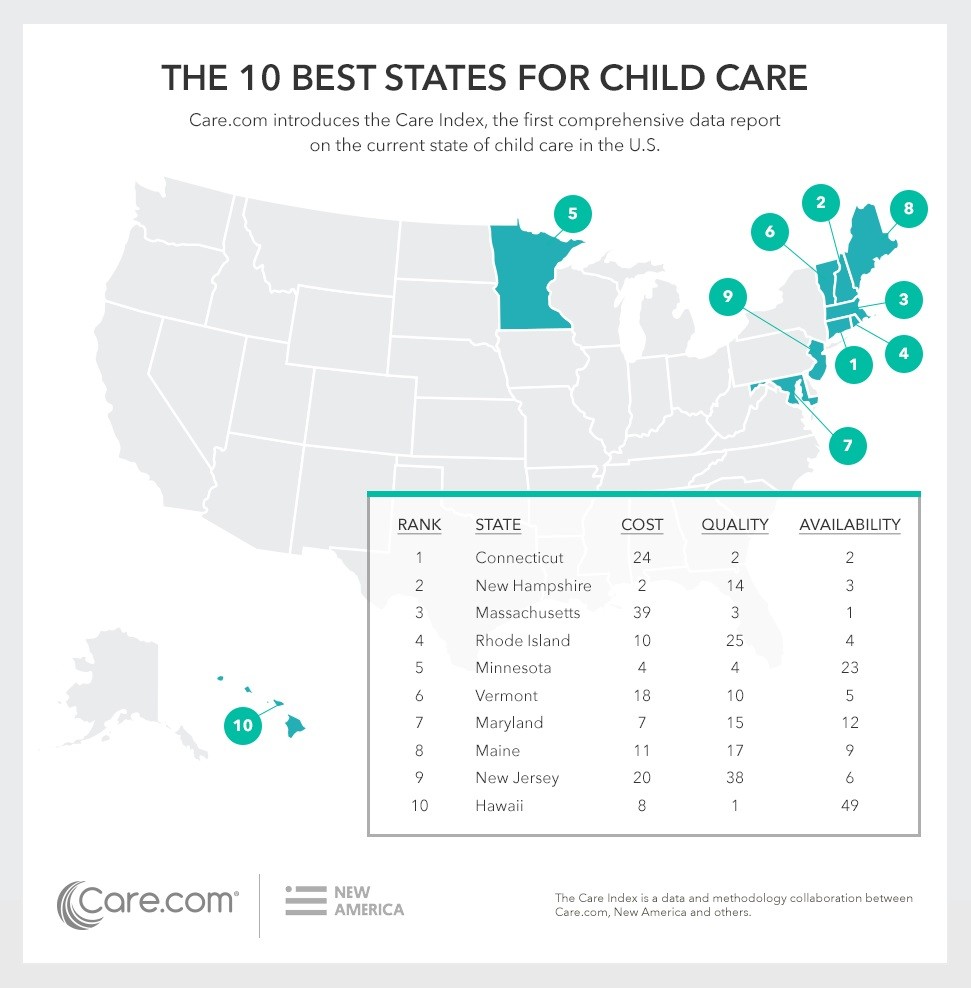
Care.com analyzed how each state ranks when it comes to child care cost, quality and availability. Providing equal weight to all three qualifying factors, the Care Index shows that even in the best states, families face trade-offs when searching for low-cost, high-quality child care that̵7;s available when they need it.
Child Care Ranking of All 50 States
When it came to the best in the country, the East Coast ̵2; and specifically the Northeast ̵2; fared the best, while many southern states ranked near the bottom.
Rank
State
Cost
Quality
Availability
1.Connecticut
24
2
2
2.New Hampshire
2
14
3
3.Massachusetts
39
3
1
4.Rhode Island
10
25
4
5.Minnesota
4
4
23
6.Vermont
18
10
5
7.Maryland
7
15
12
8.Maine
11
17
9
9.New Jersey
20
38
6
10.Hawaii
8
1
49
11.Virginia
12
26
10
12.Wyoming
3
5
44
13.Delaware
14
39
7
14.Pennsylvania
21
19
13
15.Iowa
6
9
34
16.North Dakota
1
49
24
17.Colorado
25
27
16
18.Georgia
31
13
14
19.Florida
30
18
15
20.Missouri
22
16
27
21.Nebraska
5
48
28
22.Michigan
19
43
18
23.Wisconsin
15
40
22
24.South Carolina
34
7
20
25.North Carolina
40
12
11
26.Idaho
9
11
46
27.Oregon
29
29
25
28.Illinois
37
28
17
29.Washington
33
33
19
30.Montana
17
41
32
31.Texas
16
45
38
32.Indiana
36
6
33
33.Arkansas
28
24
42
34.California
32
31
31
35.Kansas
27
35
36
36.South Dakota
23
32
45
37.Alabama
41
8
29
38.Utah
13
37
48
39.New York
45
42
8
40.Ohio
35
47
21
41.Arizona
38
30
43
42.Louisiana
44
22
40
43.Kentucky
42
34
30
44.Tennessee
47
21
26
45.Alaska
26
46
50
46.Oklahoma
43
44
39
47.Nevada
48
36
41
48.New Mexico
46
20
47
49.Mississippi
49
23
35
50.West Virginia
50
50
37
Takeaways
So what should parents do if they don’t feel that the quality of their child care is up to par? Or if their state didn’t make the Care.com Top 10 List?
If you have reason to believe your child care isn̵7;t sufficient, especially in terms of quality, it’s important to make a change.
Here are some suggestions:
- Look for locally approved N.A.E.Y.C. and N.A.F.C.C. child care centers.
- Get on community message boards and ask friends for their local suggestions. Really dig into why they love their center.
- Discuss your concerns with your child care center and see how you and some other parents might be able to initiate change. Take a list of concerns and suggestions to the center director. A large group of concerned parents can make a big difference. You can even start a private message board to discuss your center in the Care.com community.
- Create a “dream nanny” job description and send it out to friends and neighbors, and post it on Care.com. Add the hourly rate that you̵7;re comfortable paying, and see who applies. The idea behind a site like Care.com is that people who aren’t interested won’t apply.
> How to hire a nanny from start to finish
- If the cost of a nanny is too high, consider a nanny share, in which two families pay for one nanny, thus cutting their care costs in half.
> 7 questions to ask when touring a day care center
> 8 signs of a bad day care center
> 5 must-have nanny qualifications
Methodology
The Care Index is a ranking of all 50 states based on the cost, quality and availability of paid child care in each state, combining both in-home caregiving and child care center data. For more information on how cost, quality and availability are determined, go to Care.com/care-index.
The Care Index draws on unique proprietary data from Care.com member job postings and caregiver reviews, as well as publicly available data from the US Census Bureau, Bureau of Labor Statistics, the National Association for the Education of Young Children (NAEYC) and the National Association for Family Child Care (NAFCC). A survey conducted by Care.com and New America in October 2015 provides additional data on paid child care arrangements in each state among households with children.
Want to check out more of our studies? Feel free to peruse this list:
- The 20 Most Family-Friendly Cities for Halloween in 2016
- The 10 Best Cities in America to Raise the Next Rock Star
- The Best ̵2; and Worst ̵2; States for Child Care
- Dads Are Getting More Involved on Valentine̵7;s Day ̵2; By the Numbers
- Grab Your Pup̵7;s Leash: These Are the Best U.S. Cities for Walking Your Dog
- How Child Care Could Swing the Election
- How Much Do the Holidays Cost?
- Listen up, College Kids: Here Are the Top 20 Cities to Make Bank Over Break
- Want a New You in the New Year? Here̵7;s Where You̵7;re Most Likely to Make That Happen in 2017
-
$245,340. That’s how much you’ll spend on your child from birth to age 17, according to the USDA. From food to clothes to health care to education. But there’s one more expense that’s a part of this number that
-
When Keischa Pruden’s now 27-year-old son, Aaron, was first diagnosed with autism as a young child, information about the disorder was fairly minimal. “At the time, there wasn’t much support or information for autistic people or the
-
The relationship between parents and grandparents isn’t always easy. They might get on your nerves by reorganizing the baby gear while you’re away or slipping the kids extra cookies after dinner. It’s normal to expect that parents and gra
